Blackboard Learn Ultra’s Course Analytics can give you key insights into the ways that students use your tools, content, and assessments within the course. These reports can be useful in understanding what aspects of the online content are working well, seeing trends in student interactions, and charting the relationship between time spent on Blackboard and the students’ grades.
See Blackboard for more information about Analytics for Learn!
Run Reports
There are four different report types that are available through A4L.
You have the option to run the following reports:
- Course At-a-Glance: With this report, you will be able to compare data points like how much material students are getting from Blackboard and how much time they are spending in Blackboard compared to other courses in your department as well as look at individual student performance.
- Activity and Grade Scatter Plot: This graph maps the amount of time that students spend on Blackboard against their grade to see how closely these two variables correlate.
- Activity Matrix: This report generates a variety of graphs and visual representations of how students individually and collectively spend their time in Blackboard for your course.
- Course Submission Summary: This tool generates a report of the student’s submission tracking the work that they turn in over the semester.
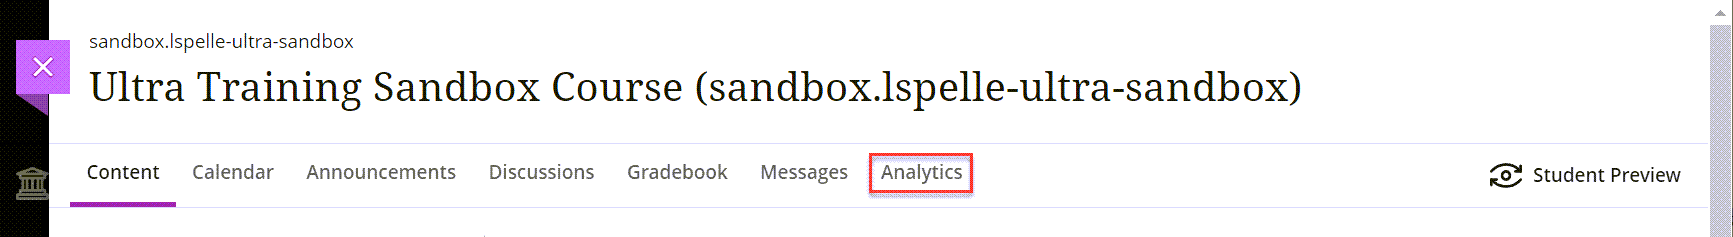
- Click on the Analytics tab at the top of your course.
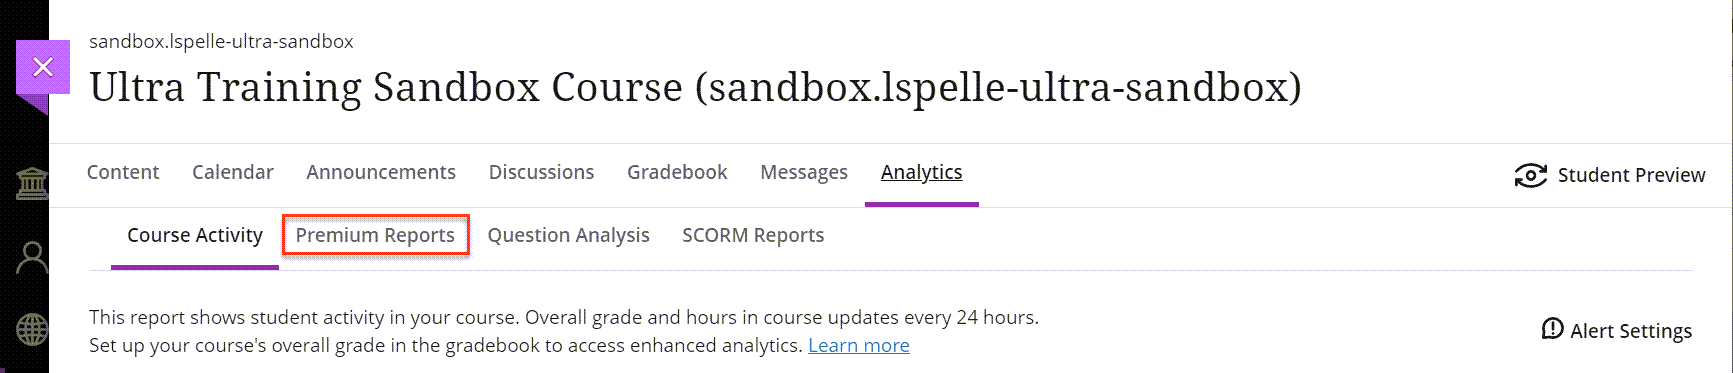
- Click on Premium Reports.
- Find the report that you would like to run, such as Course at-a-Glance, then click on the Run Report button to the right.
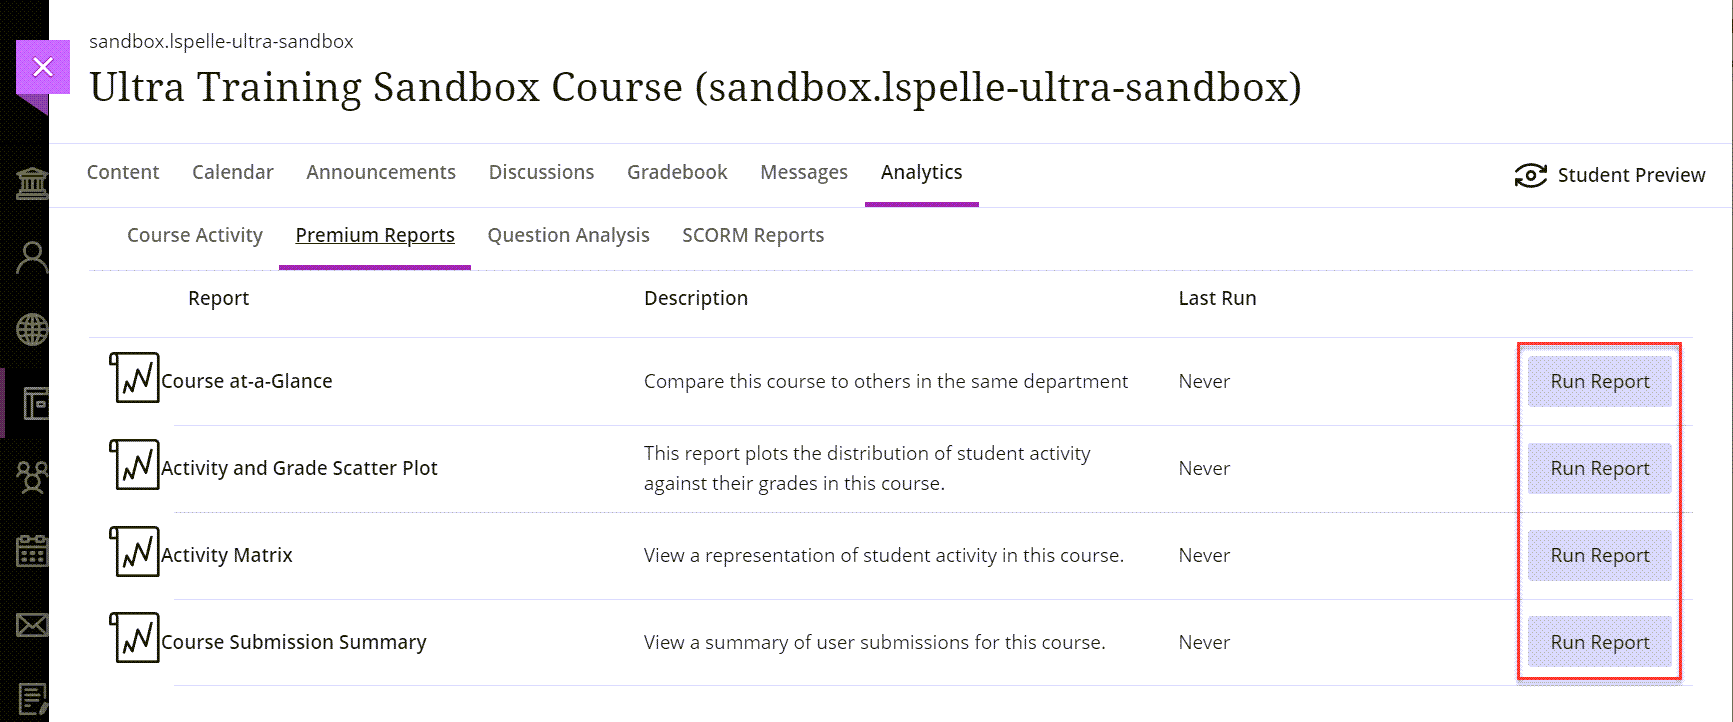
- These reports will require a few minutes to run and then will open in a new tab of your internet browser.
Course At-a-Glance
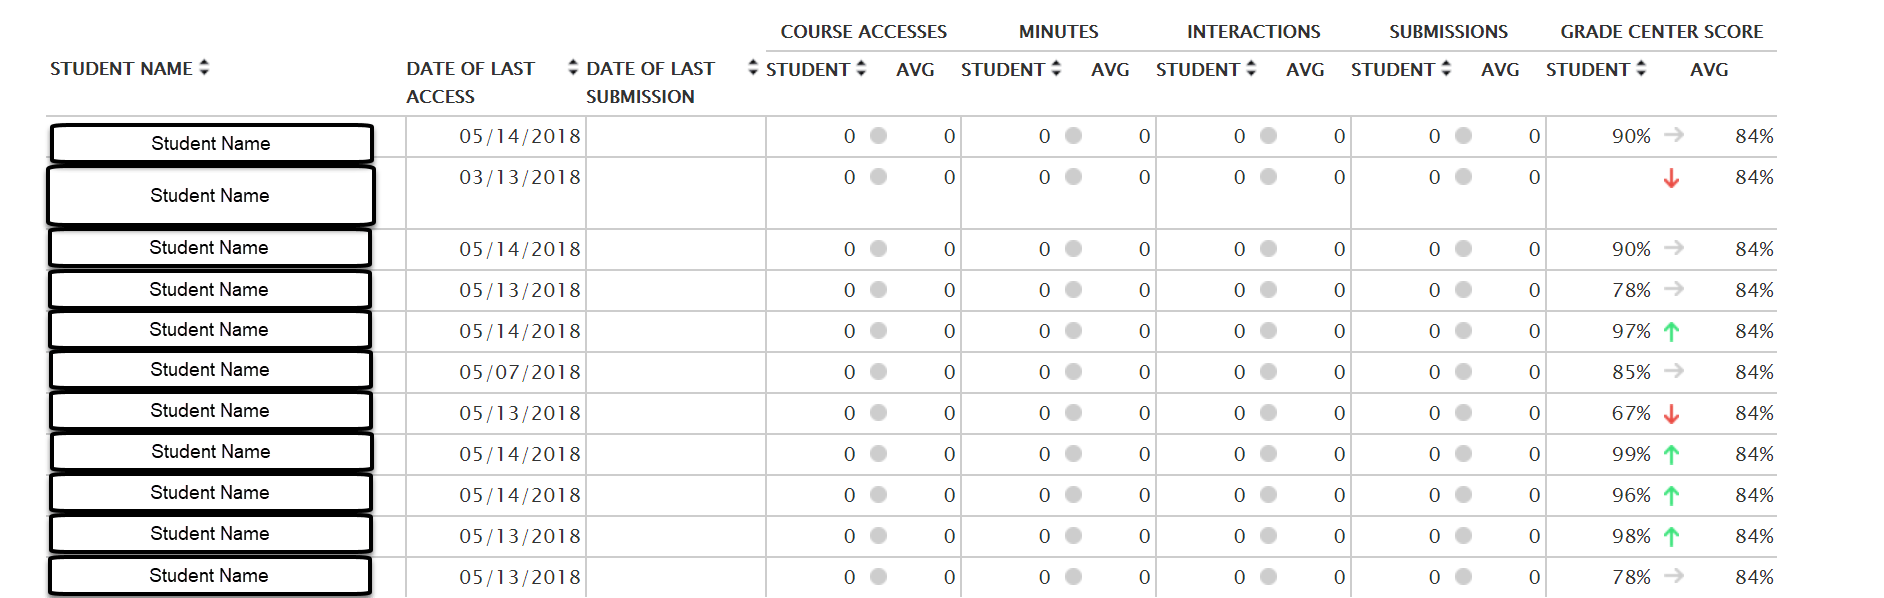
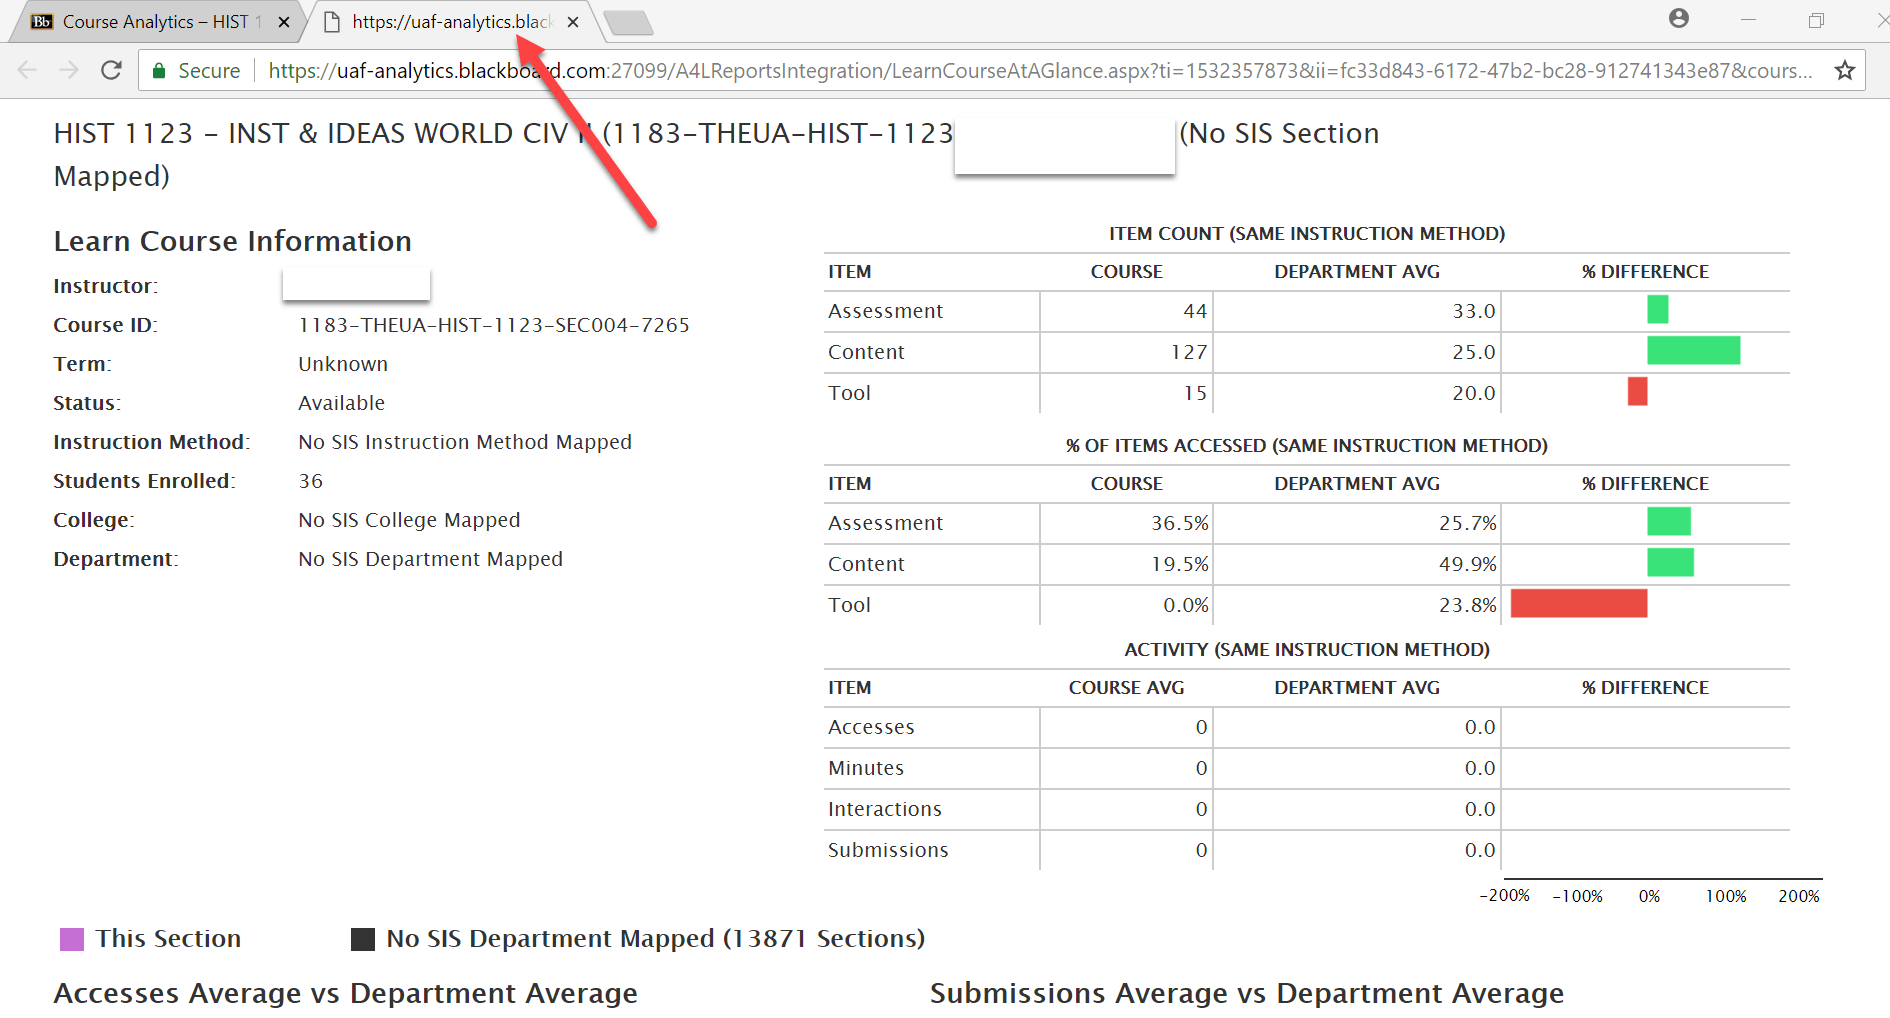
Here is an example of part of a Course At-a-Glance report:
- Assessment corresponds to the Assessments created in the course Blackboard. This will include Tests, Surveys, Assignments, and Echo360ALP.
- Content corresponds to the Build Content tab in the course Blackboard. This includes things like items, files, web links, folders, and modules.
- Finally, the last metric in this first chart is Tools which corresponds to the Tool Tab in Blackboard. This includes Discussion Boards, Blogs, Journals, and Groups as well as publisher content like Online Textbooks.
The next page of the report includes an individual student breakdown and will show how many times the student accessed the course, how long they have spent in total on Blackboard, the number of things that they have done in Blackboard, the number of assignments that they have turned in and finally their grade compared to the class average.