If you are using Echo360 to record your lectures, there are built in analytics to see who is watching the videos as well as how engaged they are when watching the videos. If you add additional content in Echo360, such as your powerpoint or other materials or create a live polling option within Echo360, you can also see analytics for these features.
To view analytics in Echo360:
- Log in to Echo360 with your UARK username and password.
- Select the course you wish to view from your list of courses.
- To the right side of the top menu, select “Analytics.”
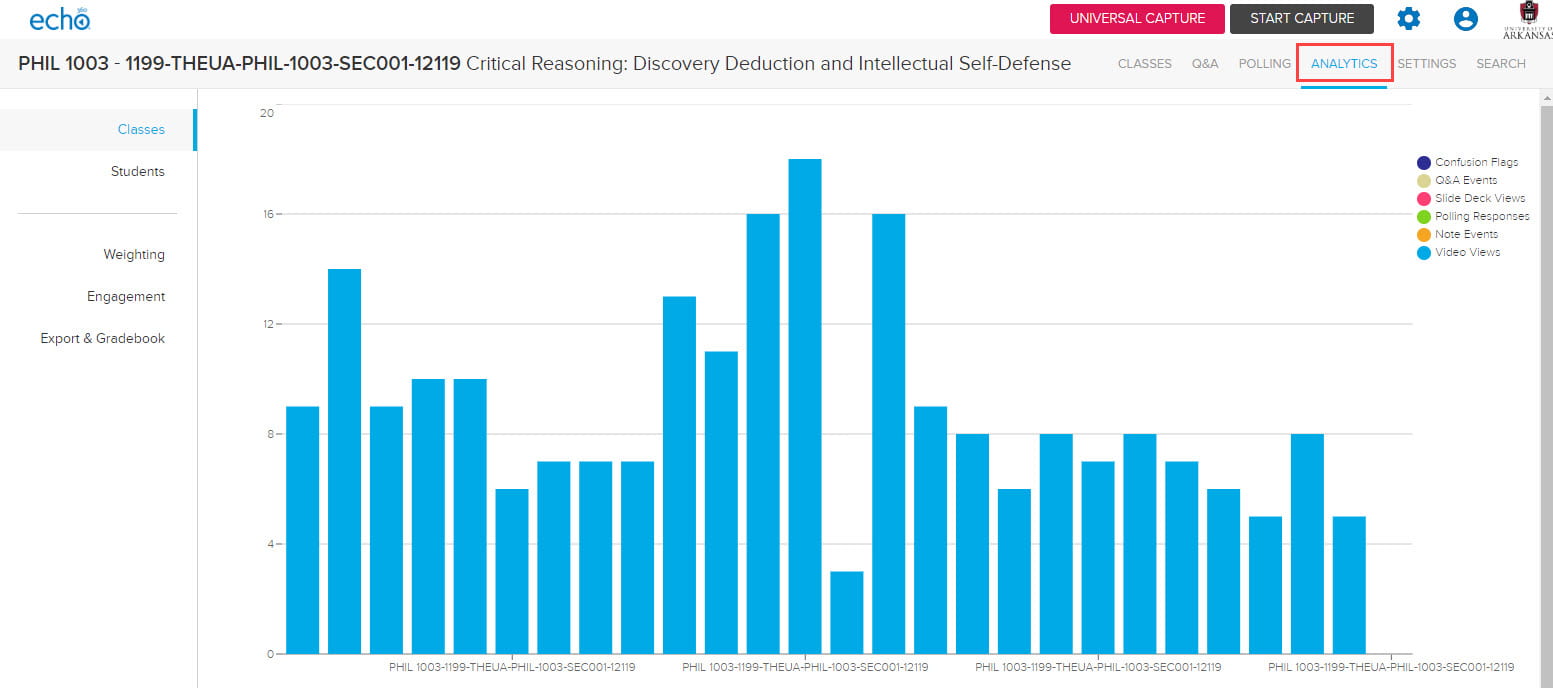
- The default display shows information about the classes. You can also click “students” on the left to view each student and how they engage with the materials.
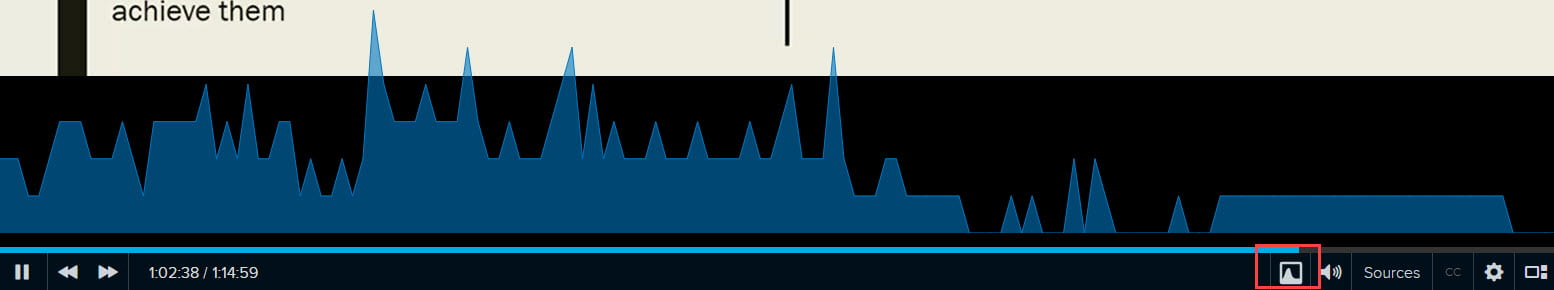
You can also see the levels of engagement of your videos by viewing a heat map of where students viewed your videos most often.
- Click on the video you would like to view and play the video.
- At the bottom of the video, click the “heat map” icon.